# Debugging
This documentation explains how you can debug frontend and backend code using Browser DevTools or VS Code debugger.
# Debugging with Browser DevTools
You can debug client-side code by using DevTools in your browser.
# Chrome
- Start development server.
- Chrome DevTools (opens new window)
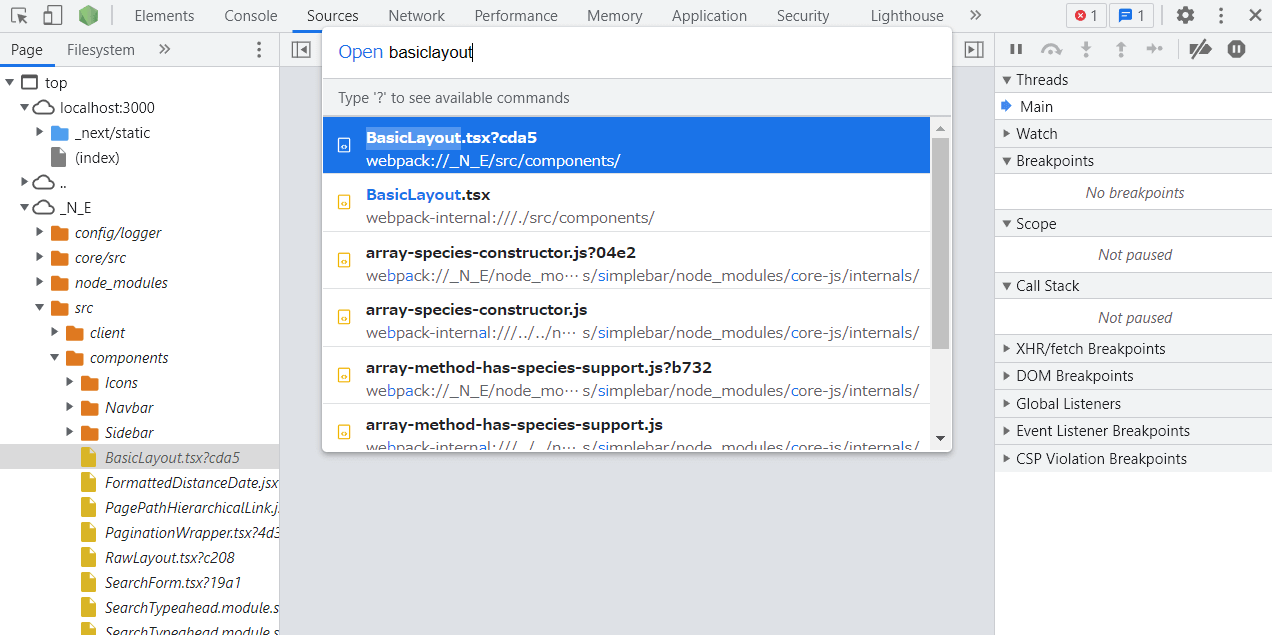
- You can debug client-side code by using the Sources panel (opens new window).
- If you open a TypeScript file by
Ctrl + P, you should choose files underwebpack://_N_E/.
# Firefox
- Start development server.
- Firefox DevTools (opens new window)
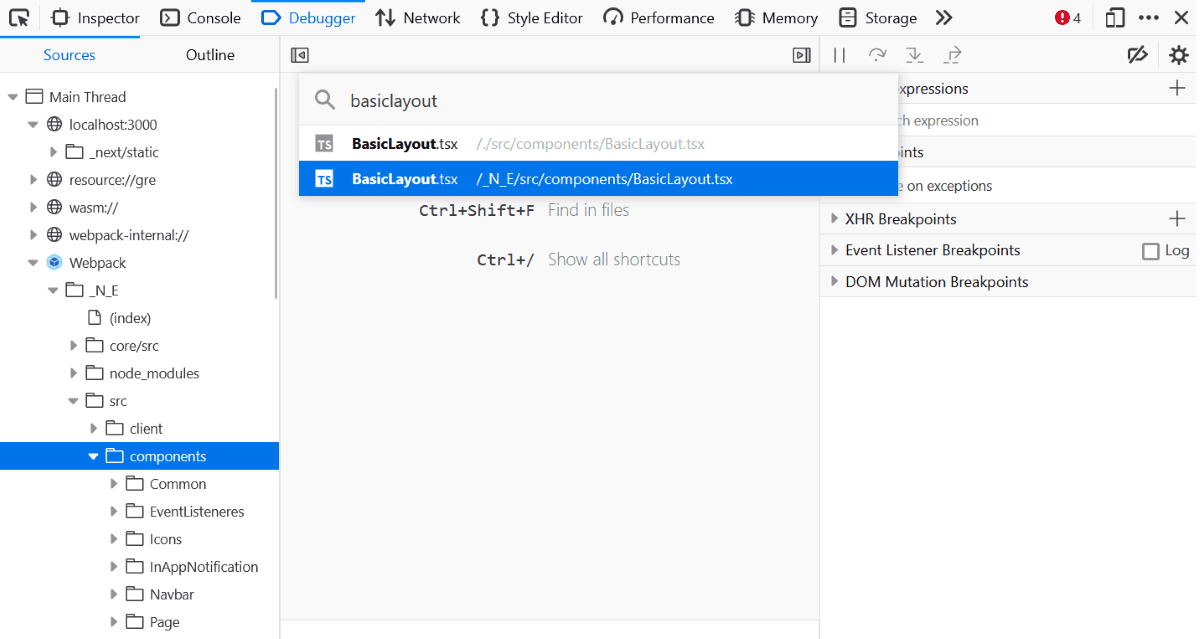
- You can debug client-side code by using JavaScript Debugger (opens new window).
- If you open a TypeScript file by
Ctrl + P, an original source file is a file of the name with a random suffix such as?xxxx.- Or you can select a file under the
Webpackfolder from the source file tree in the left column.
- Or you can select a file under the
# Debugging with VS Code
VS Code supports debugging of both client-side and server-side code.
# Client-side code
You can debug in the same way as in Debugging with Browser DevTools. Breakpoints can be set for source code being edited on VS Code.
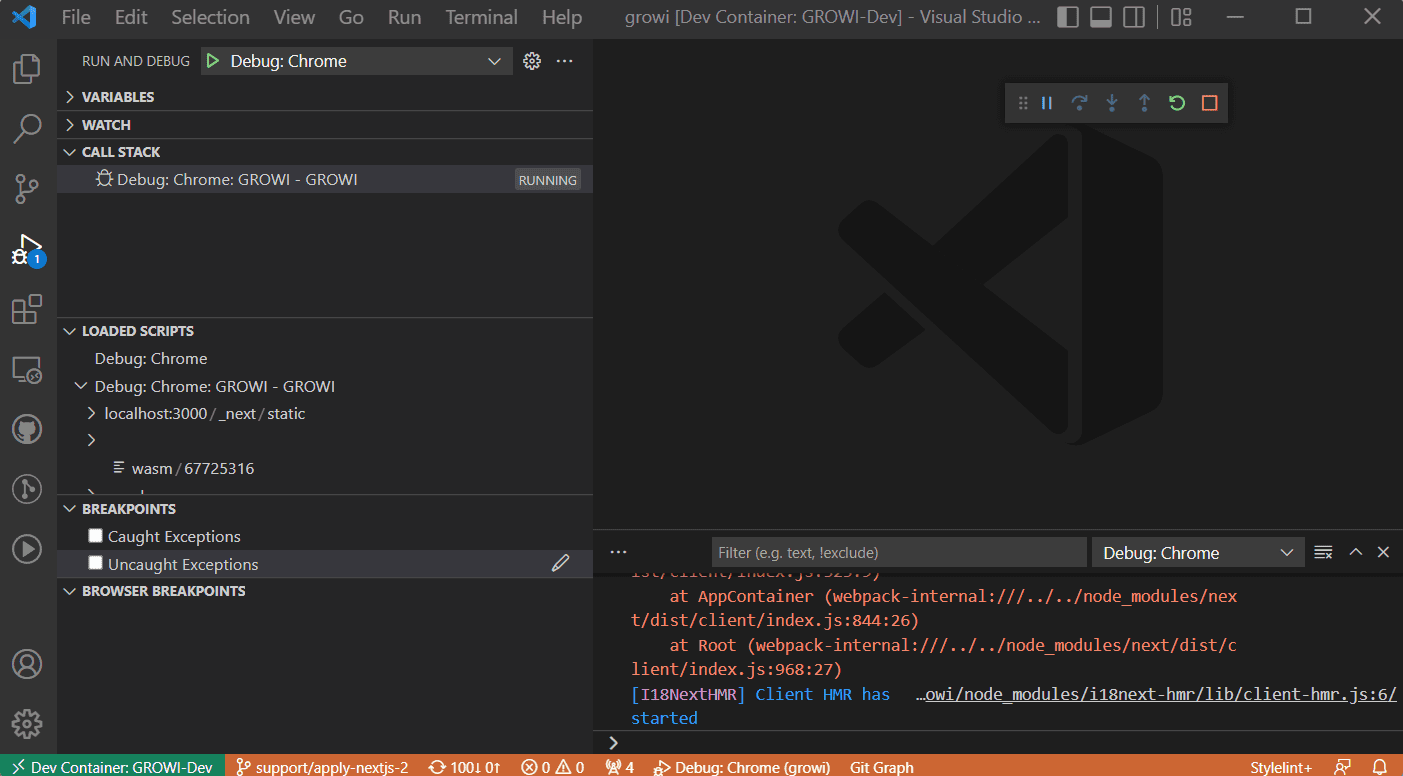
Chrome
- Start development server.
- Choose [Debug: Chrome] from the Run and Debug panel.
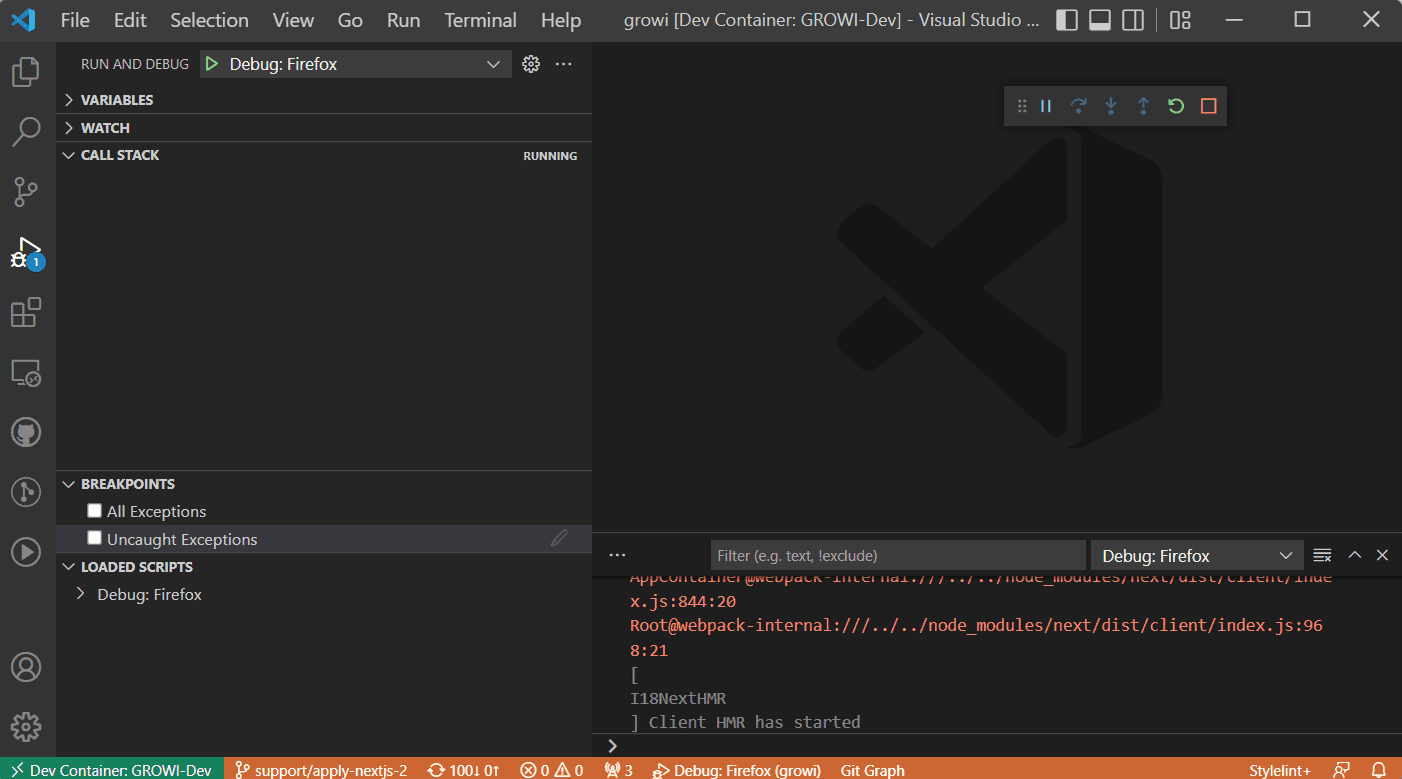
Firefox
- Start development server.
- Choose [Debug: Firefox] from the Run and Debug panel.
# Server-side code
The VS Code debugger can be attached to the development server in two ways.
Use [Debug: Attach Debugger to Server]
Features: Fast and flexible, attach/detach at any time during development
Follow the steps below: 1. Start development server first. - Verify that the
9229port forwarding is listed in the Ports panel.<img :src="$withBase('/assets/images/debugging-portforwarding.png')" alt="Portforwarding"> 1. Choose [**Debug: Attach Debugger to Server**] from the **Run and Debug** panel. <img :src="$withBase('/assets/images/debugging-vscode-attach-debugger-to-server-debugger.png')" alt="VSCode Attach Debugger to Server debugger">
Use [Debug: Server]
Feature: You can set breakpoints for the server startup process
Follow the steps below: 1. Select [Debug: Server] from the Run and Debug panel.
<img :src="$withBase('/assets/images/debugging-vscode-server-debugger.png')" alt="VSCode Server debugger">
If the debugger is attached successfully, the status bar of VS Code turns an orange color. In this state, you can debug by setting breakpoints in any server-side code.
Handling Unbound Breakpoints
If you set a breakpoint but still get an Unbound breakpoint, check the following.
- Verify that it is imported/required from Express code.
- Among the files under
packages/app/src/pages, the file with the extension*.page.tsis Pages Component of Next.js (opens new window). Since these files have not yet been compiled immediately after the development server is started, breakpoints cannot be set. Please compile a page component by accessing the relevant page from your browser. - If you are experiencing instability with your breakpoints being enabled or disabled (unbound breakpoints), consider setting the
--nolazyoption to your Node.js process. Reference: Breakpoint validation (opens new window)